

Latest Content 🔥
Check out the latest content from our blog. We write about marketing, business, and technology — comin’ in hot weekly!
5 Best Invoicing Software Platforms [2024]
Invoicing software is an online tool that lets you generate invoices for rendered products or services. It is the perfect way to get paid promptly from anywhere and keep track of records. Invoicing software creates a list for all services and products with their corresponding cost and the total sum of the payable amount. It…

How To Download YouTube Videos [Updated 2024]
Want to jump straight to the answer? The best way to download YouTube videos is by subscribing to YouTube Premium or using a tool like 4K Video Downloader. YouTube is one of the most popular social media websites. The video-sharing website hosts billions of hours worth of content, with one video more intriguing and fascinating…
How To Sell on Fiverr [2023]
Whether as a side hustle, or a full-fledged career, you can thrive on Fiverr if you have the right potential and know how to use that potential. Many beginners get confused while starting on Fiverr because the selling process is slightly different than most other freelance marketplaces. As a level 2 seller on Fiverr, I…

How to Transfer a Domain from GoDaddy
Different domain registrars offer different features and prices. Besides, the security level isn’t the same at all registrars. When your website is growing, it may be necessary to transfer the domain to a new registrar. As GoDaddy is a popular domain registrar, many users try to transfer a domain from GoDaddy. But how do you…

150+ Gym Name Ideas [2023]
Choosing the perfect name for your gym business is an essential first step in crafting a brand that resonates with potential clients. Your gym’s name should reflect its unique personality, motivate individuals to break a sweat and leave a lasting impression. In this article, we have curated a diverse and creative selection of name ideas…
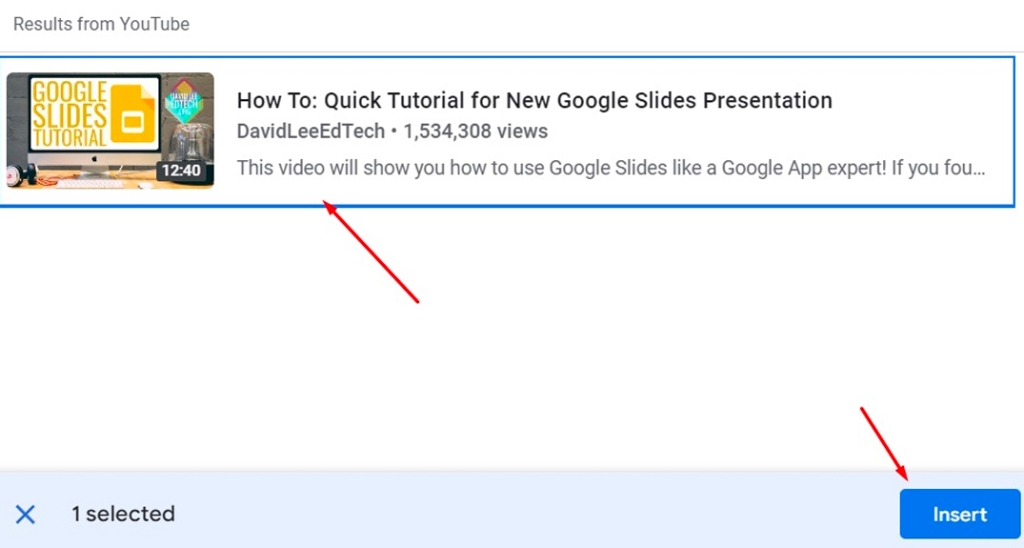
How to Add a Video to Google Slides [2023]
When you are presenting a complex topic with Google Slides, adding a video to your presentation can take it to the next level… but many folks still don’t know how to add a video to Google Slides. In this guide, we will show you how to add a video in Google Slides in three different…